

Financial Tables in Numerical Reasoning Tests: Revenue, Profit and Margins
A financial table might show revenue, costs and results across several teams or years. The challenge in a numerical reasoning question is usually not the complexity of the mathematics. It is choosing the right row and column, applying the right definition, and preserving the units.
In this guide, we use a fictional business to practise turning a financial table into clearly explained answers.
Start with the definitions
Revenue is the amount generated from sales in the period shown. Costs are the expenses included in the table's stated measure. Profit, for these examples, is revenue minus the listed costs. Profit margin is profit divided by revenue, expressed as a percentage.
This example uses a simplified operating-profit calculation. Real financial statements can include additional cost lines, exceptional items, financing costs or taxes. Never assume that a table's “costs” have the same definition as every other financial statement.
Worked example: a regional financial table
The table below shows fictional revenue and the costs used for this exercise, all in £000.
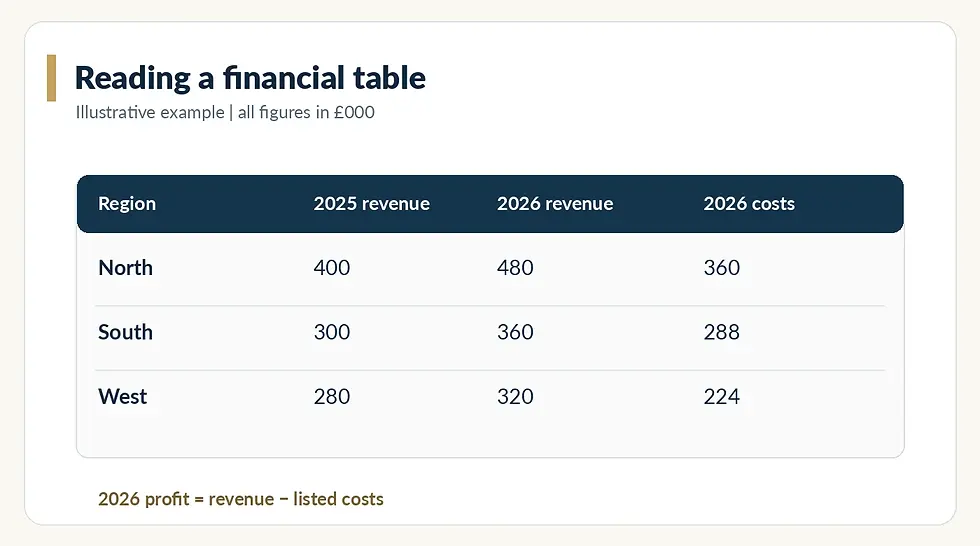
Region | 2025 revenue (£000) | 2026 revenue (£000) | 2026 costs (£000) |
|---|---|---|---|
North | 400 | 480 | 360 |
South | 300 | 360 | 288 |
West | 280 | 320 | 224 |
Total | 980 | 1,160 | 872 |
Question 1: What was West's profit in 2026?
Revenue − costs = 320 − 224 = 96 in £000.
Answer: £96,000. Make sure you report currency, not simply “96”.
Question 2: Which region had the highest 2026 profit margin?
Calculate profit, then divide by each region's revenue:
North: (480 − 360) ÷ 480 × 100 = 25%.
South: (360 − 288) ÷ 360 × 100 = 20%.
West: (320 − 224) ÷ 320 × 100 = 30%.
Answer: West, at 30%. North had the largest absolute profit (£120,000), but West had the largest margin. Those measures are not interchangeable.
Question 3: What was the total 2026 profit?
Total revenue = 480 + 360 + 320 = 1,160 (£000). Total listed costs = 360 + 288 + 224 = 872 (£000).
1,160 − 872 = 288 (£000).
Answer: £288,000. You can cross-check by adding the three regional profits: 120 + 72 + 96 = 288.
Question 4: By what percentage did North revenue grow between 2025 and 2026?
(480 − 400) ÷ 400 × 100 = 20%.
Answer: 20%. The correct denominator is the 2025 revenue, because it is the starting value.
The difference between margin and mark-up
Both use profit, but the denominator changes:
Margin = profit ÷ revenue × 100. Mark-up = profit ÷ cost × 100.
For West in 2026, profit is 96, revenue is 320 and costs are 224. Margin is 96 ÷ 320 = 30%, whereas mark-up on the listed costs is 96 ÷ 224 = 42.9% (approximately). If a question asks for one, do not give the other.
Common table-reading errors
Mixing years. A 2026 profit calculation needs 2026 revenue and 2026 costs, not the prior-year revenue.
Dropping units. A figure of 480 under “£000” is £480,000. A total of 1,160 is £1.16 million.
Comparing totals with rates. Largest revenue, largest profit and highest profit margin can belong to different regions.
Treating all costs as equal. Use only the columns and definitions given. The table may not include every cost required for a formal accounting profit figure.
Rounding too soon. Retain adequate precision until the final answer, especially for close multiple-choice options.
Try it yourself
Using the same table, calculate the following before reading the answers.
Practice A: What is South's 2026 profit? Practice B: Which region produced the highest absolute profit in 2026? Practice C: What share of total 2026 revenue came from South, to one decimal place? Practice D: What was the total 2026 profit margin, to one decimal place? Practice E: If North's 2026 listed costs rose by 5% while revenue remained £480,000, what would its revised profit be?
Answers and workings
A — £72,000: 360 − 288 = 72 (£000). B — North: North 120, South 72 and West 96 (£000); North's £120,000 is highest. C — 31.0%: 360 ÷ 1,160 × 100 = 31.034…%, rounded to 31.0%. D — 24.8%: 288 ÷ 1,160 × 100 = 24.827…%, rounded to 24.8%. Do not take the simple average of the three regional margins, because the regions have different revenue totals. E — £102,000: New costs = 360 × 1.05 = 378 (£000); new profit = 480 − 378 = 102 (£000).
Build a useful checking habit
Before calculating, underline the row label, column heading and units. Write a one-line formula. After calculating, compare your answer with the scale of the table: if the business made £480,000 in revenue, a profit of £1.2 million would clearly be inconsistent with the figures supplied.
With practice, that short sense-check becomes automatic and catches more mistakes than trying to work faster without a method.
Explore SS Solutions for numerical practice
SS Solutions is being developed for numerical reasoning practice on Mac, with suggested workings and an optional iPhone companion display. It is currently in private beta. AI-generated calculations and chart interpretations can be wrong, so check the underlying figures and respect the rules of any formal assessment.
Next guides: Reading charts · Percentages and ratios
Practice guide from Set Sail Solutions Ltd. All numbers are illustrative and fictional. The guide is educational content, not financial advice or an example of actual company accounts.


Comments